
The Economy, According to the Headlines vs Reality
(Spoiler: They’re Not the Same)
If you’ve been feeling like the economic news sounds suspiciously recycled every week, congratulations — your brain still works.
Because once again, we got a batch of labor data that’s being framed as “fine” if you squint hard enough… and absolutely horrifying if you actually read the numbers.
Let’s get into it.
Economic News
1️⃣ ADP Jobs Report: “Meh” Would Be Generous
In what can only be labeled same old, same old, the January ADP private jobs report showed a labor market that is, for lack of a better word, lackluster.
- Private payrolls: +22,000 jobs
- 40% below December
- 52% below expectations
Without the 74,000 jobs added in health and education, this report would’ve been a straight-up disaster class.
The only bright spot?
Wages for those still employed rose 4.5% year-over-year.
So once again, the Fed gets to play its favorite game in 2026:
- Do you care more about inflation?
- Or do you care more about a cratering labor market?
So far, they’ve tried to appease both — and it’s working about as well as you’d expect.
The official January jobs report drops soon. I’m not optimistic.
2️⃣ The JOLTS Report: An Absolute Train Wreck
The December JOLTS report (yes, the delayed one) was… brutal.
Let’s run the tape:
- Job openings: 6.5 million
- Lowest since September 2020 (hello, COVID)
- November revised down: -218,000 openings
- 2025 vs 2024: Over 1 million fewer job openings
- December vs November: -386,000 openings
- December vs October: -900,000 openings
- January layoffs: 109,000
- 118% higher than January 2025
- January hires:5,000 total
- Lowest January hiring since 2009
To say this was a slew of horrible labor market news is an understatement.
And yet… don’t expect urgency. I suspect these numbers will get much worse before Agent Orange and his crew are forced to acknowledge that the labor market is quietly falling apart.
Top 10 IINvestments Going Ex-Dividend Next Week
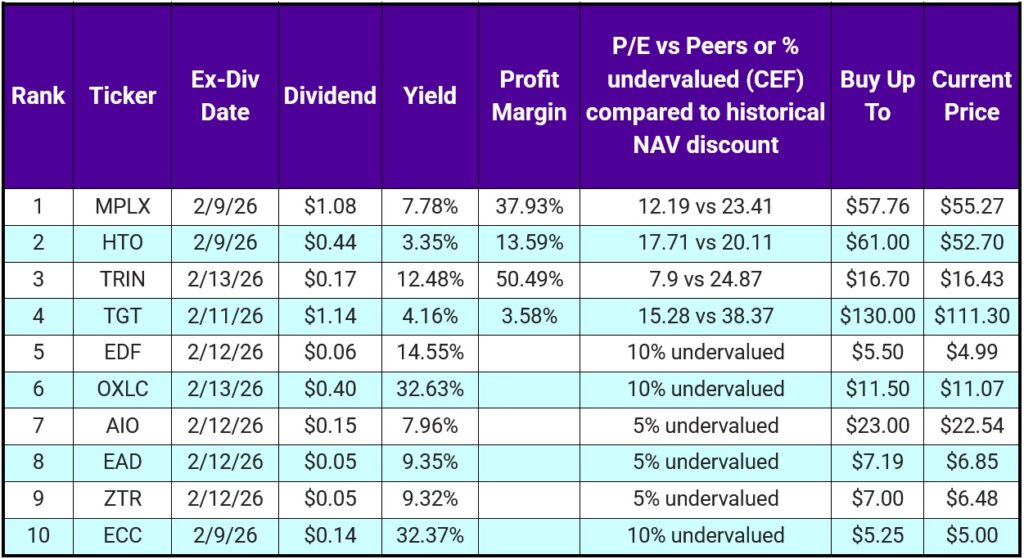
We built this list live during the last livestream, and if last week didn’t do it for you and you stayed in cash — this week is materially better.
🌟 Essential Need-To-Know:
*LPG does go ex-div on 2/9, so we weren’t crazy in the livestream. We just couldn’t find the proof until today. LPG would be on the list in position 4, kicking ECC off the board.
Dividend Growers (The Anchors)
- MPLX – 13-year dividend streak (midstream infrastructure)
- HTO – 58-year streak (water utility)
- TGT – 54-year streak (consumer staple)
All three are solid. Valuations on MPLX, HTO, and TGT are good to great.
The Rest of the List
- TRIN – BDC, now paying monthly (excellent company, wait for pullbacks)
- EDF – Emerging markets CEF (non-U.S. exposure finally paying off)
- OXLC – Debt-focused CEF, absurd yield, absurd volatility
- AIO – AI-focused CEF
- EAD – Corporate bond/loan CEF
- ZTR – Global infrastructure CEF
- ECC – Junk bond CEF (huge yield, huge swings)
- *LPG – Natural gas, pays a really good special dividend that’s hidden
⚠️ Important note:
Do not chase OXLC or ECC unless you’re comfortable with volatility. That said, a 30%+ yield cushion does make entry price mistakes far less painful.
We currently hold HTO, TRIN, and TGT.
And yes — we’ve owned every single one of these names at least twice over the years. This list isn’t theoretical for us.
Portfolio Updates
1️⃣ Retirement Portfolio
We deployed idle cash into 9 shares of SWKS. Still undervalued and dropped our cost basis by over $2 per share.
2️⃣ Vanning Portfolio: BDC Rotation
We exited FSK at roughly a 10% loss. Financials are fine, performance hasn’t been.
We rotated into ARCC — the biggest, baddest BDC in the space:
- ~18.6% undervalued
- 97% payout ratio (more sustainable)
- Trading below book value
- Dividend fully covered by NII
- $1.20+ per share in spillover income, covering nearly 9 months of dividends
Yes, income drops:
- FSK: ~20% yield ($133/quarter)
- ARCC: ~9.5% yield ($62/quarter)
Sometimes you sacrifice the queen to win the game.
3️⃣ CIVI → SM Merger
If you held CIVI, you now own SM:
- 1 CIVI share → 1.45 SM shares
Normally I sell post-merger. This time, we’re holding:
- SM has better financials
- Better debt control
- ~70% undervalued
- 13 analysts covering it with a buy rating
Income takes a hit:
- CIVI: $0.50 quarterly → $48
- SM: $0.20 quarterly → $28
But SM has:
- 49% 5-year dividend growth
- 22% 10-year growth
CIVI cut its dividend 50% last year. Enough said.
4️⃣ MPW → MPT
MPW changed its ticker to MPT.
Nothing else changed. Just a rebrand.
5️⃣ Income Portfolio Trim: COIW
We trimmed 100 shares of COIW:
- COIN: -18% YTD
- COIW: -28% YTD
- Weekly dividend: $0.11 (not cutting it)
We rotated into:
- WNTR (19 shares)
- ULTY (21 shares)
YTD comparison:
- COIW (100 shares): $106
- WNTR + ULTY combo: $93
Short term looks worse — long term cash flow looks much better:
- COIW: $10–$20/week
- WNTR + ULTY: $18–$22/week
Until crypto wakes back up, this is simply better math.
🧠 Final Thought
Weak labor data. Revisions everywhere. Fewer jobs. More layoffs.
And yet, we’re told everything is stable.
This is why we stay focused on income, valuation, and flexibility — not headlines.
Cash flow doesn’t care about narratives.
Want Instant Notifications For These Investing IINsights?
We post these updates to several places where you can subscribe and get notified as soon as we post.
- Substack
- LinkedIn Newsletter
- Our email list (no spam, just 1 email a week). Sign up below.