If you’re feeling like prices didn’t magically behave just because the headline says they did… you’re not crazy.
The “official” inflation report finally dropped, and the top-line number is supposed to be reassuring. But once you get past the headline and into the guts of the report, the story changes fast.
So here’s what matters, what I think is being smoothed over, and what we’re doing in the portfolios.
Economic News
1️⃣ CPI Headline: 0.2% in January / 2.4% YoY
That’s the headline.
Now here’s the part that matters: I’m 100% certain the data is being “managed” after going line-by-line through the full 38-page report.
Why I’m saying that:
- Rural vs. city inflation doesn’t match reality.
The numbers that align most closely with the “official” report look a lot more like the rural data — not the city data. And unless we’re pretending cities are suddenly cheaper than rural America, that’s a red flag.
- Seasonal adjustments look… extremely convenient.
Seasonal adjustment is supposed to account for normal volatility. But compared to last January, the adjustments are meaningfully different — and not in a “normal variation” way.
Example: Food seasonal adjustment
- 2025: 0.05
- 2026: 0.025
That reads like smoothing over bad news by tweaking the adjustment.
- Food subcategories don’t reconcile with the top-line.
In the food category:- 12 of 17 subsectors are up
- 11 are up over 1% MoM
- only 3 are down more than 1% MoM
Now I’m not a math genius, but if the cumulative movement is over 16% and the average is around 0.9%, I can’t fathom how the “official” increase for the broader inflation picture is 0.2% without some creative reporting.
And that’s one example from one half of one page in a 38-page report.
Takeaway:
Don’t fall for the propaganda. Trust your eyes and your wallet. This story is going to dominate 2026.
2️⃣ The Two “Quiet” Reports That Should’ve Been Everywhere
Two economic stories got nowhere near the coverage they deserved this week — and both punch holes in the “best economy in the world” narrative.
A) Fed research: tariffs were paid 94% by American consumers
A Federal Reserve report came out showing the tariffs were 94% paid for by U.S. consumers this year.
That number is high. It’s being disputed by the regime. But if it’s accurate, the implications are brutal:
- Tariffs become a consumer tax
- That means families pay roughly $1,000–$2,400 more for the same goods than they did pre-tariffs
- And because it’s essentially a tax on consumption, the Fed’s precious 2% inflation target may never be hit
Estimates floating around suggest about 0.76% of current inflation is directly tied to tariffs. That’s… not nothing.
Less money + higher prices = reduced spending power (households, small businesses, everyone who doesn’t print money for a living).
And economists not on the regime payroll are estimating growth could get shaved by 0.4% to 0.6% per year going forward because of these tariffs.
B) Commerce: 2025 trade deficit = basically unchanged from 2024
The Department of Commerce reported the 2025 trade deficit was no different than 2024 — you know, before the tariffs.
We were promised a surplus. We ate the “short-term pain.” Here’s the trade-off we supposedly accepted:
- ~1% loss in GDP
- ~460,000 jobs lost
- ~$1,500 less in the average bank account
…for the greater good of a better trade position later.
Turns out we took the losses and the deficit didn’t improve.
And if you look at physical goods specifically (not services like banking/tourism), the deficit actually expanded by around 2%.
We were promised a bill of sale. All we got was bad data and erosion in trust — and that always bites us later.
Also: U.S. debt is around 80% of GDP, meaning a lot of the people we’re pissing off hold American debt. If they dump that debt, the economy gets real uncomfortable real fast.
Takeaway:
Tariffs didn’t “hit them.” They hit you. And the scoreboard (trade deficit) barely moved.
Top 10 IINvestments Going Ex-Dividend Next Week
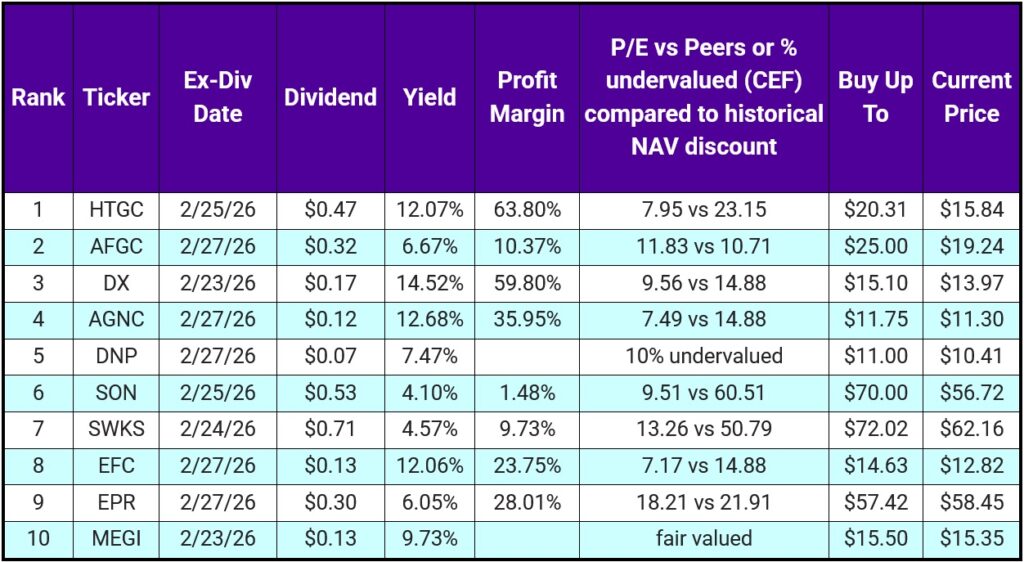
This week’s list is actually pretty good. A mix of undervalued dividend growers and high-yield names with clear “know what you own” risk.
I’ll go bottom-up.
- MEGI — closed-end infrastructure fund. Should be around $14.25–$14.50, but the historical discount has it looking fair valued.
My move: wait for under $15. - EPR — entertainment REIT (movie theaters, ski lodges, arcades). Not your normal REIT.
My move: fair valued here — I’d wait for under $57. - EFC / AGNC / DX — three mREITs with different risk profiles:
- EFC: credit-focused; commercial/residential/consumer loans; less reliance on guaranteed agency paper
- AGNC: mostly agency/guaranteed loans (Fannie/Freddie)
- DX: hybrid — roughly half agency, half non-agency
Note: lower rates in 2026 will affect all three.
- SWKS — semiconductors/tech where you rarely see yield above 1%.
This is the weird part: you’re getting paid ~4.5% while you wait because I think it’s deeply undervalued (10%+). The “experts” and I vastly disagree on this one. - SON — packaging company, a couple years away from dividend king status. Severely undervalued.
- DNP — utility CEF trading at a steep discount vs historical discount to NAV.
Monthly pay + ~7.5% yield with potential capital appreciation. Yes please. - AFGC — preferred of AFG (well-run insurance company). More than enough income to keep the preferred paid.
Currently 20%+ undervalued, so you collect ~7% while the price works toward fair value over time. Yes please. - HTGC — one of our favorites at IIN. With projected ~7% growth over the next 5 years, it’s at least 25% undervalued.
We currently hold: DX, SON, SWKS, AGNC, AFGC, and HTGC.
Because we hold these, here are my valuation estimates using my data:
- DX: at least 25% undervalued
- SON: at least 25% undervalued
- SWKS: according to the “experts” fair valued or maybe ~3% overvalued
- AGNC: 10%–15% undervalued
- AFGC: ~23% undervalued
- HTGC: at least 25% undervalued
Quick note on methodology (for transparency):
We get fair value by using projected growth + profitability metrics (ROE, ROIC, EPS, and projected EPS growth). Not perfect, but not too messy either.
Portfolio Updates
1️⃣ Vanning Portfolio: ARCC Adds
Cash this week went into ARCC. Still undervalued — and anytime it drops below $19.50 and we have cash, we pick up shares.
2️⃣ Vanning Portfolio: New Position— BAH
We freed up $2,500 to initiate a new position in BAH (Booz Allen Hamilton).
Why it fits now:
- AI + cybersecurity solutions
- 97%–98% of revenue comes from the federal government (specifically DoD)
- and DoD spending is expected to grow for the remainder of Agent Orange’s term
Financial snapshot that matters:
- growth estimates: 6% (low) to 16% (high)
- some projections have EPS up ~50% over 3–5 years
- 14 straight years of dividend raises
(yes, the “defense companies can’t pay dividends” order could complicate that — we’re watching it) - payout ratio: ~34%, so the current ~3% yield is well covered
- debt: under $4B (2025)
- revenue: around $12B (2025)
- ROIC: 24%
- ROE: 78% (yes, it’s high — it’s a money-making machine)
According to my data/formulas: BAH is ~30% undervalued after the pullback.
We now own 31 shares, and if price stays below $85, I’ll continue accumulating.
3️⃣ Retirement Portfolio: SWKS + SM
Cash this week was split between SWKS and SM.
- SM is what CIVI became after the merger. Dividend is lower ($0.20 vs $0.50), but the financials and trajectory are way better than CIVI ever was.
- SWKS is still about 10% the below my fair value
- SM is around 50% below fair value
So yep — backing the truck up on both this week. Beep beep!
Want Instant Notifications For These Investing IINsights?
We post these updates to several places where you can subscribe and get notified as soon as we post.
- Substack
- LinkedIn Newsletter
- Our email list (no spam, just 1 email a week). Sign up below.